Macro for active traders
A beginner course in reading the market, using our free research, and deciding when to wait.
What you will learn
By the end, you should be able to explain a market move in plain English, read a macro dashboard without treating every number as a signal, and decide whether an idea deserves further work. You will know the difference between an economic fact, what traders expected, what prices already reflect, and what could make them change again.
You do not need to forecast GDP to two decimal places. You do need to notice when the market is surprised, when the story is changing, and when the price has already travelled too far for your proposed trade.
Our free research is built to help with those questions. It curates macro regimes, central-bank developments, narratives, positioning and cross-market behaviour for people making decisions over the coming sessions and weeks. It supplies a dated reading and evidence to investigate. You decide whether to trade, wait, manage an existing position, or remain flat.
Lesson 1 — The economy and the market are related, but they are different things
Teaching aim: Explain what macro means to a trader and why a good economic fact may produce no trade.
Macro is the broad setting in which markets operate: growth, inflation, interest rates, government policy, credit, trade and shocks such as an interruption to oil supply. These forces can affect currencies, gold, commodities and stock indices. The connection is seldom a neat one-line rule. Higher inflation might make a central bank raise rates, which could support a currency. It might also damage purchasing power, company earnings or trust in that currency. You have to identify the mechanism in this market at this time.
Consider the sentence, “Inflation is falling.” Useful background. Now suppose nearly everyone expected it to fall even faster. The actual figure may be a disappointment. If markets had already priced several rate cuts, interest-rate expectations could move the other way. Knowing the level of inflation did not tell us how to trade the release. Knowing the expectation and response gets us closer.
An investor buying an index fund for many years may ask whether a development changes long-run earnings, valuation or the allocation they want to hold through a full cycle. An active trader asks what might change over the next few sessions or weeks, who has to adjust a position, where the opportunity is at today’s price, and how much can be lost before the idea has time to work. Investors can use the same macro facts; the holding period changes the decision.
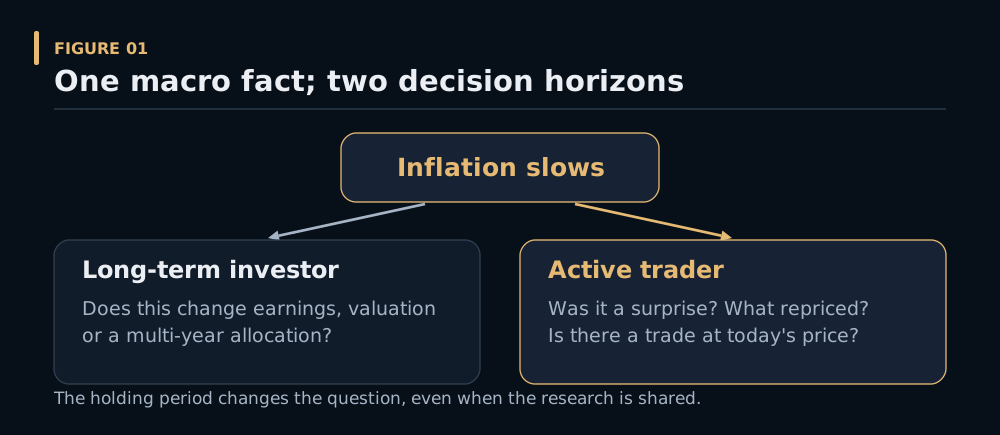
Figure: The same macro fact leads to different decisions over different horizons.
| Same research item | Longer-term investing question | Active trading question |
|---|---|---|
| Inflation slows | Does this alter the multi-year earnings and rate backdrop? | Was it slower than expected? Did rate pricing and the asset move? Is anything left? |
| A central bank speaks | Does the broad policy cycle change? | Did the bank say something different from what the market had priced? When is the next test? |
| Gold rallies sharply | Does gold still fit the portfolio allocation? | Who is buying now? Is this a continuing story, a crowded rush, or a possible exhaustion move? |
| An index sells off on a shock | Does the long-run allocation still make sense? | If I hold a position, should I cut exposure now and reassess while flat? |
Try it: Write two questions about a headline, “Oil jumps after a supply disruption.” One should be a long-term investor’s question; the other should ask whether an oil, currency or equity-index trade is attractive during the coming week.
Takeaway: Macro sets the scene. A trade needs an expectation, a transmission channel, a price and a risk decision.
Lesson 2 — The simple macro map: growth, inflation and central banks
Teaching aim: Read a regime summary without turning it into a buy/sell rule.
Begin with two questions: Is growth improving or weakening? Is inflation pressure building or easing? We often show those changes as a four-Quad map. A Quad describes the direction of change, rather than promising which asset must go up. Our monthly reading also looks for a possible next Quad. Timely evidence can point to a transition before slower official releases confirm it. That makes the Quad a useful early alert. It does not make the next gold, dollar or index move automatic.
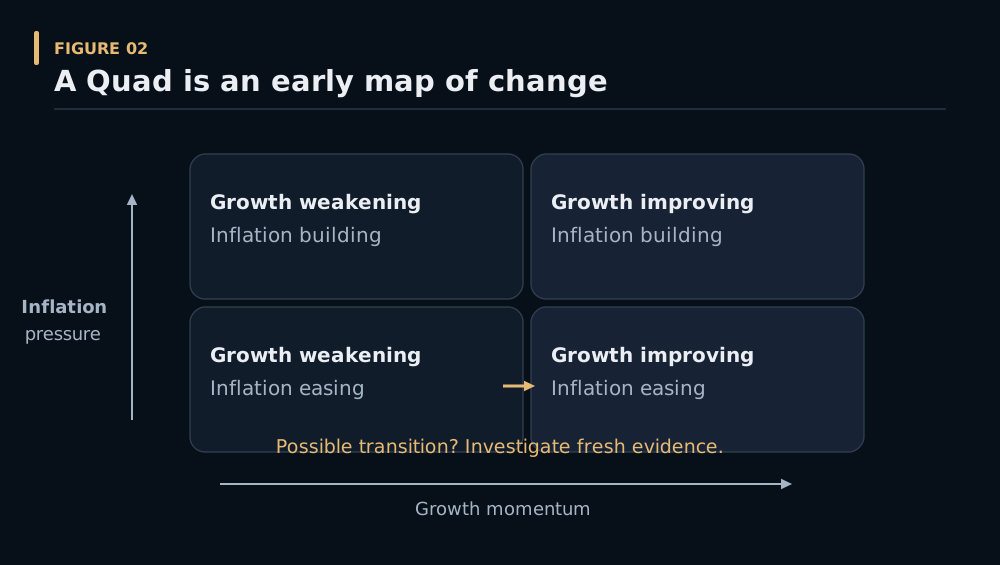
Figure: The Quad is an alert to investigate; it is not an asset signal.
Next comes the central bank. Its reaction function means, in ordinary language: What information would cause this bank to change its policy? A bank worried about persistent wages may respond differently from one facing an isolated energy-price spike. We read its decisions, forecasts, minutes and speeches to learn what it currently cares about. Then we compare that with what interest-rate markets already expect.
Think of a chain:
Growth and inflation change → a central bank may respond → traders adjust the expected path of rates → currencies and other assets may respond.
The chain can run in the other direction during a shock. If oil supply is suddenly threatened, oil may move first, then inflation expectations and rates. You are allowed to notice the obvious event before the monthly macro model catches up.
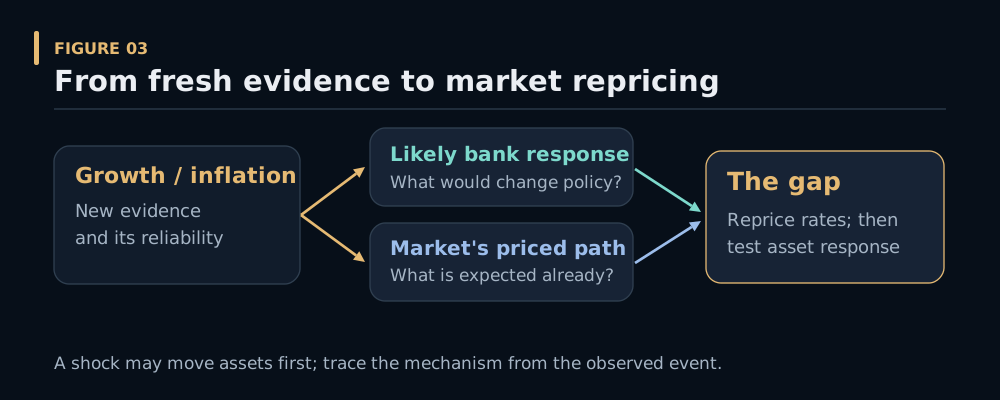
Figure: The useful question is often the gap between likely policy and priced policy.
Try it: A country has improving growth and rising inflation. Its central bank has already warned that rates may rise, and rate markets have priced that rise. Is “growth and inflation are rising” by itself a reason to buy its currency? Explain what you would check next.
Takeaway: The Quad helps you ask better questions. The possible gap between the bank’s likely response and market expectations is often more useful to a trader than the Quad label.
Lesson 3 — The market trades the difference from expectations
Teaching aim: Separate the release, the expectation, the price response and the opportunity remaining.
Before an important release, record what was expected before it happened. A consensus compiled afterwards is not a pre-release forecast. Record what rate and asset markets implied at the same time. After the release, compare the actual result, any revisions and the market response. Finally ask how much of the expected adjustment has already occurred.
Imagine a wholly hypothetical U.S. inflation release:
- Forecasters expected monthly underlying inflation of 0.3%.
- The actual release is 0.1%.
- Short-term U.S. rate expectations fall, the dollar weakens and gold rises.
That is a plausible chain, not a permanent law. A trader still asks: Did the central bank care about this particular measure? Was the miss caused by one temporary component? Had investors already bought gold in anticipation? Did gold rise 3% before we could obtain an entry, leaving little room against a normal reversal? Did the dollar weaken broadly or only against one currency?
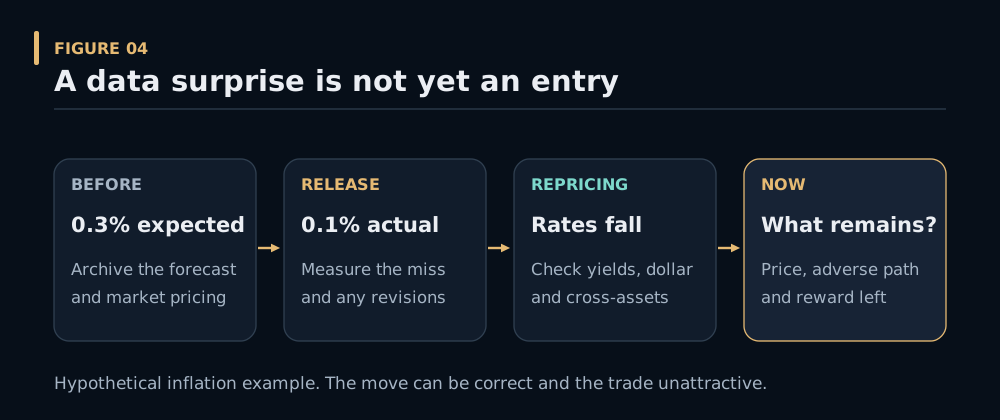
Figure: A surprise and a strong first move do not settle whether a trade remains.
Sometimes good news produces little further rise. That may mean it was expected, the market is crowded, another force is stronger, or the story is losing power. A single muted reaction does not prove which explanation is right. It tells you where to investigate.
Use these five columns for any event:
| Before | Actual | Repricing | Price response | Remaining question |
|---|---|---|---|---|
| What did traders expect? | What happened, including revisions? | Did expected policy or risk change? | Which assets moved, when and how much? | Is there still a trade at today’s price? |
Try it: The expected inflation result was 0.3%; the actual result was 0.3%; gold jumps anyway. Write two possible explanations and one piece of evidence you would seek before accepting either.
Takeaway: “I correctly predicted the data” and “I have a good trade now” are different claims.
Lesson 4 — Stories, positioning and the people who may have to act
Teaching aim: Understand why an accepted story can keep running, and why it can suddenly fail.
A market narrative is the explanation traders currently use for the move. For example, “Investors expect easier policy, so lower yields support gold.” A narrative is more useful when we can observe repeated price responses consistent with it. We also ask what would challenge it. If gold stops rising on news that previously lifted it, the story may be maturing or a different force may be taking control. We do not declare a narrative dead after one strange candle.
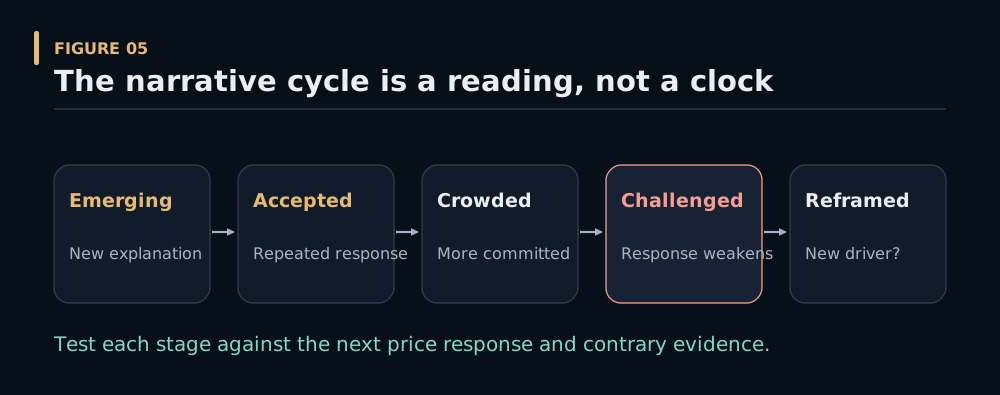
Figure: Narrative stages are hypotheses tested against repeated price responses.
Positioning asks who already owns the trade. If many participants are long, they may continue buying in a powerful trend. If the story changes and price falls, those same positions may add fuel to the decline as holders reduce risk. Crowded does not mean “sell now.” It means, “What catalyst and price move could make the crowd uncomfortable?”
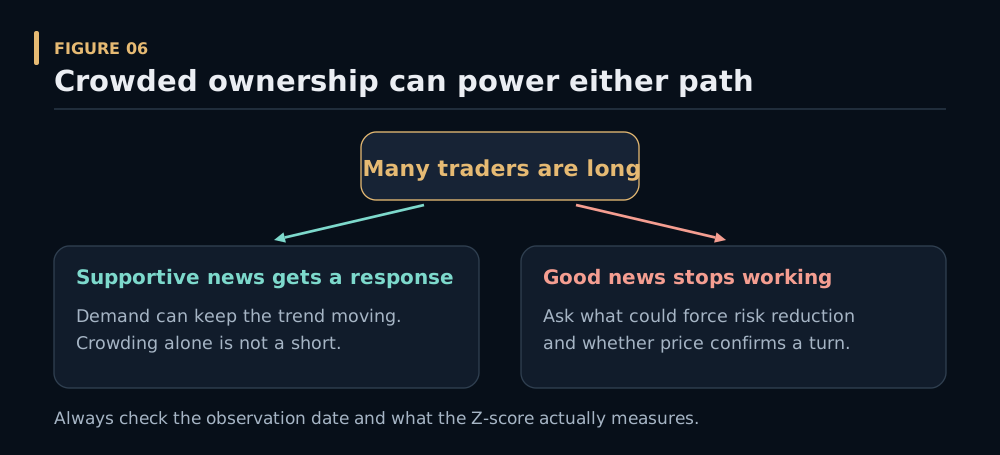
Figure: Crowding can sustain a trend or amplify an exit, depending on catalyst and response.
Our dashboard may show a one- or three-year Z-score. This simply says how unusual a defined measure is relative to its own history. Always read the label: a positioning Z-score describes unusual futures ownership; a price Z-score would describe unusual price extension. Neither is a reversal command. Public CFTC positioning reports describe a past observation, normally Tuesday positions published Friday, so the market may already have moved since the measured date. CFTC explains the report timing.
Correlations tell us how two series have moved together over a stated window. They can change under a new driver. If gold usually falls when yields rise but now rises alongside yields, ask what else has changed. Do not force yesterday’s relationship onto today’s market.
Try it: A futures market has a very crowded long position and price makes another new high after strong news. Is that a short idea? Now imagine strong news arrives again and price cannot make progress. What new question appears?
Takeaway: Narrative and positioning help you understand who may have to change their mind or their exposure. You still need a catalyst and an observable response.
Lesson 5 — How to read our free research in five minutes
Teaching aim: Turn a curated dashboard reading into a small number of sensible questions.
Our research brings together the broad regime, possible changes in growth and inflation, central-bank communication, the market’s current story, positioning and cross-market behaviour. It is deliberately written for a trader asking what could matter soon. That is why you will see timestamps, catalysts, what changed, potential contradictions and conditions that would make the reading wrong. A historical investor report can be excellent research, but a trader also needs to know whether the event is tomorrow, whether prices have already moved, and whether the opportunity has survived that move.
Use three passes:
Pass 1 — Orient. Check the as-of time. What is the dominant driver? Which markets are in focus? Is the Quad a stable backdrop or a possible transition? What is the story traders seem to believe?
Pass 2 — Find the change. What is different from the previous reading? Did a central bank change its emphasis? Did positioning become more crowded? Did a usually reliable cross-market relationship break? Did price respond as the story predicted? A headline repeated five times is still one event.
Pass 3 — Decide what you need. Are you flat, watching an idea, entering, reviewing an open trade or exiting? What was expected and priced? What event comes next? What price would be acceptable? What would invalidate the idea? If a decisive item is missing or stale, write unresolved and remain on the watchlist.
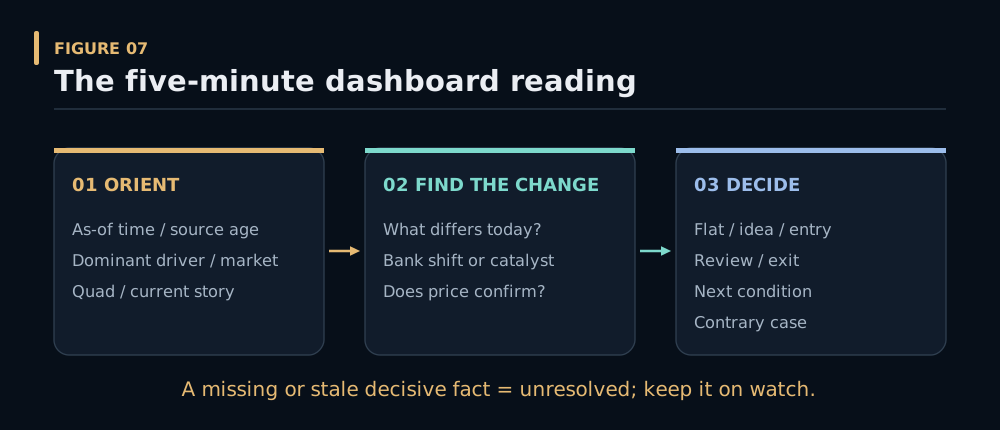
Figure: Orient, identify what changed, then make a conditional decision.
Here is the small reading card to keep beside the screen:
| Question | Your answer |
|---|---|
| As-of time and market in focus | |
| Main driver in one sentence | |
| What changed since the prior reading? | |
| What was expected or already priced? | |
| What did price do with the new information? | |
| Who may need to buy, sell or reduce? How do we know? | |
| Next catalyst and date | |
| Strongest case against the idea | |
| My state: flat / research / entry / review / exit | |
| My next action and review condition |
If the dashboard says “gold narrative: mature” and “positioning: crowded,” it is giving you two questions to test. If gold remains strong through adverse news, the trend may still deserve respect. If it stops responding to supportive news, the balance may be changing. You decide what the actual price and risk allow.
Try it: Open a dated free reading. Fill only the first four rows of the card. If you cannot find the data cutoff or source age, write that as a research gap; do not assume the page is live.
Takeaway: The purpose of free research is to shorten the distance between a mountain of information and a good decision. It cannot make the decision for you.
Lesson 6 — From a reading to a trade, a wait, or a quick exit
Teaching aim: Give beginners a limited playbook and introduce risk and the longer holding period.
Learn two entry patterns first:
- Post-catalyst continuation. An important event changes expectations, other participants still appear to be adjusting, and price confirms the change. Wait for an entry where the remaining move looks worthwhile relative to the adverse path.
- Failed-consensus reversal. A widely accepted story is challenged. The market stops responding to news that used to help it, then begins to move against crowded positions. Seek evidence of an actual turn; crowded positioning alone is insufficient.
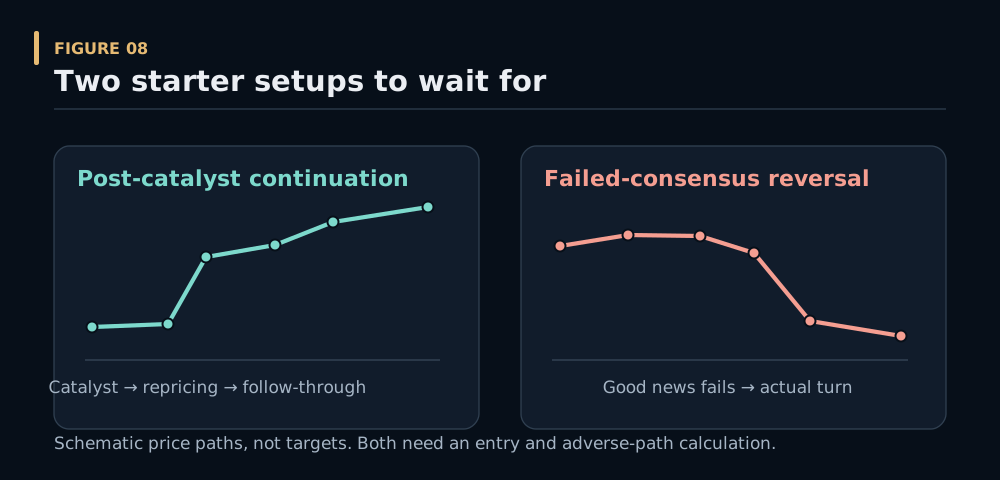
Figure: Two simple patterns to observe without trying to trade every market move.
Both patterns can occur in FX, gold, silver, an index or oil. A big obvious shock can become the market’s main event. A new trader does not need to be a specialist in every market to understand a verified supply disruption or a broad equity repricing. They do need to know the instrument they are trading, what one point is worth, how volatile the market has become and what could make them wrong.
There is also a skill to learn before a new entry: when a shock damages your current position’s premise, or a winner becomes parabolic and its remaining payoff looks poor, be ready to reduce or go flat. Then take time to reassess. A later short or a developing right-side-of-the-V long is a new trade, with a new entry and risk decision. High volatility is a reason to adjust size and execution assumptions, not an automatic reason to avoid a good opportunity.
For each candidate, state:
“I am watching [market] because [what changed]. The market appears to expect [what]. I would consider [direction] only if [catalyst/price condition]. The idea is wrong or unattractive if [observable condition]. I will review it [when].”
The same idea can run for 9–20 trading days if evidence and remaining payoff continue to justify it. Around day five, compare the original thesis with new facts, the narrative, current price and risk. Day five is a review, not an expiry date. After a major shock, review immediately rather than waiting for the calendar.
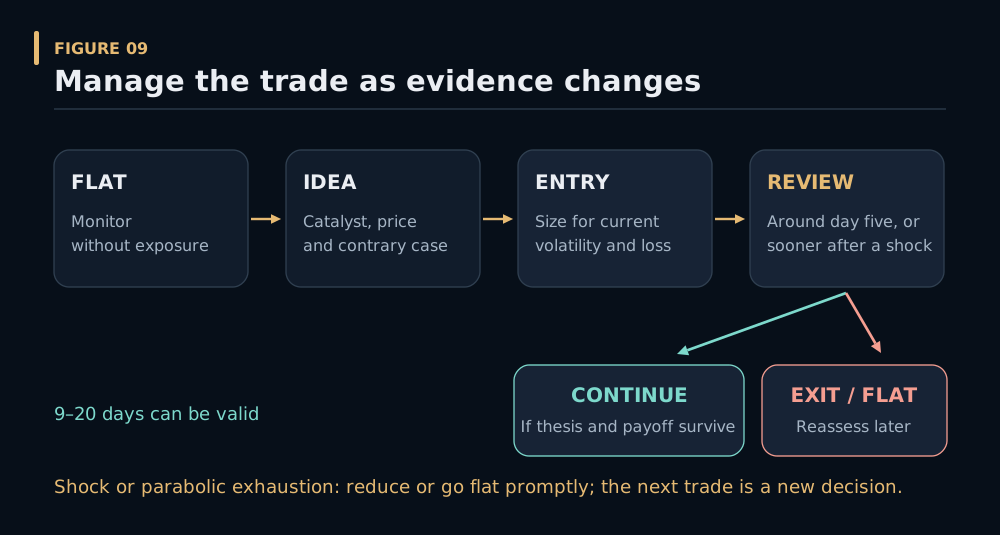
Figure: Review the thesis and payoff; after a shock, act without waiting for day five.
Before placing a CFD or futures trade, calculate the value of a point in the exact contract, the plausible adverse move, spread and other costs, and the loss from the full exposure. Margin is collateral; it does not define the maximum possible loss. Gaps and slippage can change execution.
Try it: Write the one-sentence plan for an idea on your watchlist. Then write the strongest argument against it. If you cannot name an acceptable entry and adverse path, your current decision is wait.
Takeaway: An active trader earns the right to act by having a reason, a price, a contrary case and a risk plan. Flat is a real position.
Final exercise — A Friday that looks obvious after the fact
Everything in this exercise is invented. You are reading a Friday dashboard at 14:00 UTC:
- A U.S. employment release is weaker than the archived pre-release consensus.
- U.S. short-term yields fall and the dollar weakens across several currencies.
- Gold rises 2.5% in a short time. Its futures positioning was already unusually long at the last available observation.
- A major U.S. index falls despite the lower yields; credit spreads widen.
- You are flat. A friend is already long the index.
Answer before reading the suggestions below:
- What is observed, and what is your interpretation of the central bank’s likely response?
- Why might gold rise while the index falls, even though both are reacting to lower yields?
- Does crowded gold positioning mean you should short it? Does its 2.5% rise mean you should buy immediately?
- What should your friend consider first? What should you investigate before any new position?
- If you enter a trade and hold it past day five, what would you reassess?
Suggested discussion
The release, yields, dollar, gold, index and credit moves are observations if the sources and times check out. “The central bank is certain to cut” is an inference; confirm what it has said and what the rate market now prices. The index may be responding to concern about future earnings or tighter credit rather than enjoying lower discount rates. Gold could be reacting to rates, the dollar or demand for safety. Test those explanations rather than treating either relationship as a law.
Existing long positioning can fuel further gains or make gold vulnerable if the story fails. The 2.5% move requires a fresh entry and adverse-path calculation. Your friend’s immediate question concerns the existing index exposure and whether its thesis survives the release and credit response. You, while flat, can afford to let the first move pass and investigate a continuation or reversal later. At day five, compare what happened with the original thesis and ask whether the reward left from the current price still pays for the risk.
The one-minute summary students should remember
State: What is changing in growth, inflation, policy or risk?
Expectation: What did traders think would happen?
Story: Which explanation currently influences behaviour?
Positioning: Who is already committed, and who might have to adjust?
Catalyst and response: What changed, and what did prices actually do?
Decision: Is there a worthwhile trade at this price, an existing risk to remove, or a good reason to wait?
Our free research helps you see those pieces together. The best use of it is a clear decision you can explain and revisit, including the days when that decision is no trade.